System Design Phase 1 — Part 11: Observability Basics
📚 Table of Contents
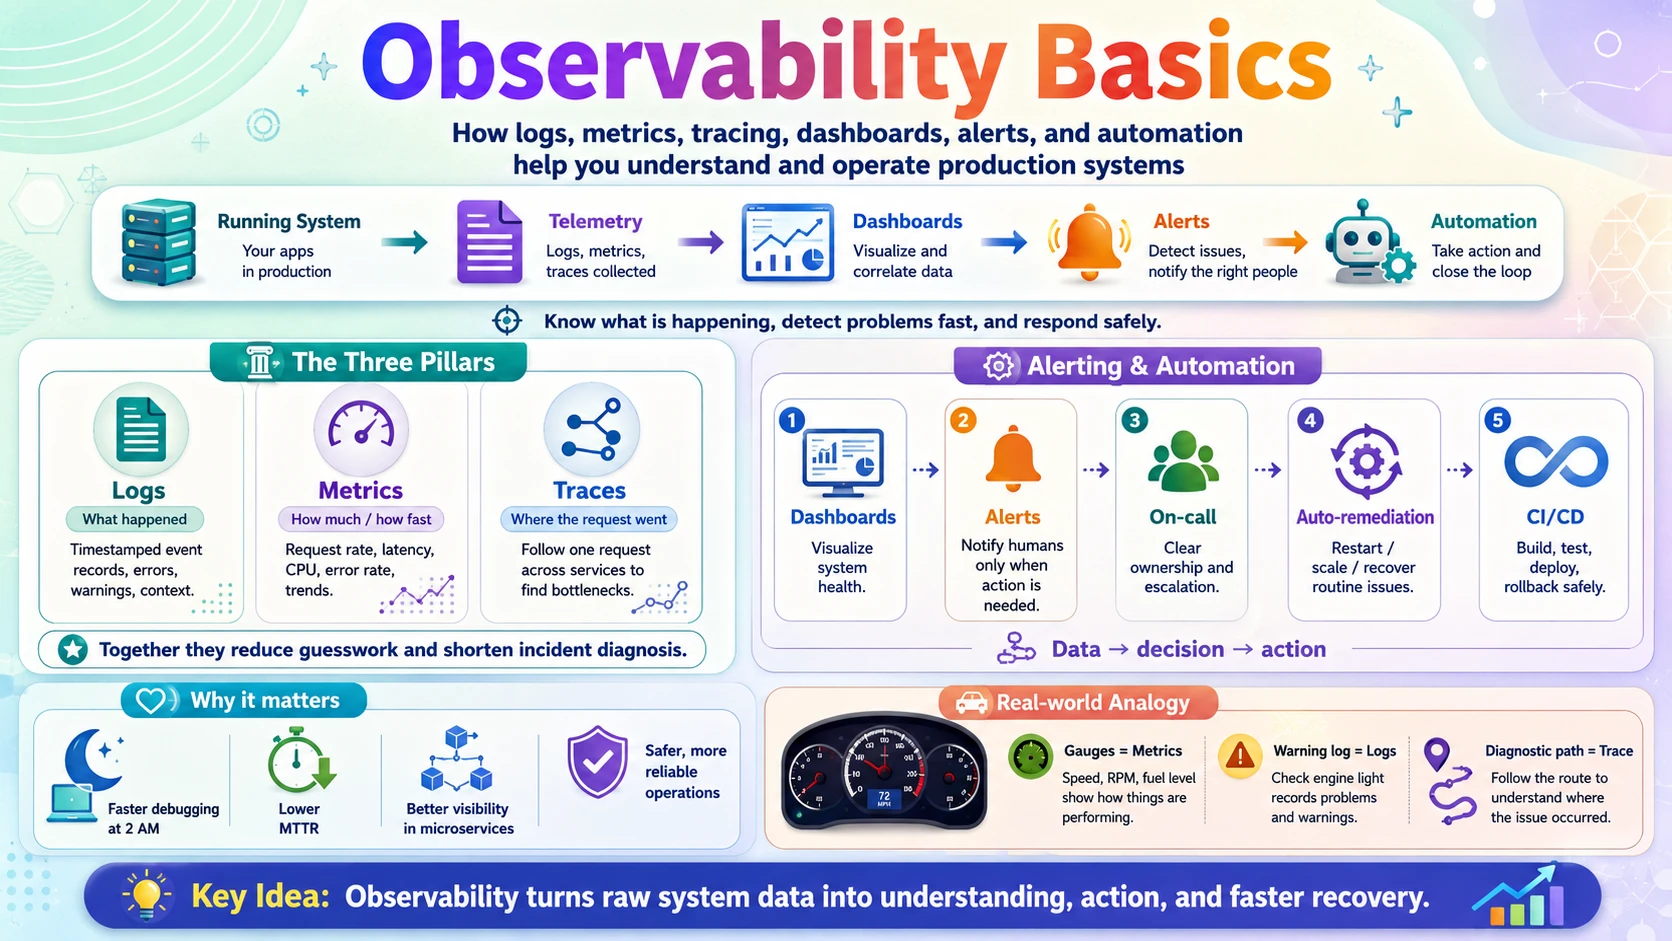
You've built a system that's scalable, reliable, and secure — but once it's running in production, how do you know what it's actually doing? When something breaks at 2 AM, can you find out why in minutes, not hours? That's the job of observability: the ability to understand a system's internal state from the outside, using the data it emits. This is the final post of Phase 1, and it ties the whole foundation together. You will start with The Three Pillars — logs (what happened), metrics (how much / how fast), and distributed tracing (where a request went across services). Then you will learn about Alerting & Automation — turning that data into dashboards, alerts that page a human only when it matters, and the CI/CD pipelines that ship changes safely. Each topic is explained with real-world analogies, step-by-step examples, and clear diagrams — starting from zero.
👁️ 1. The Three Pillars
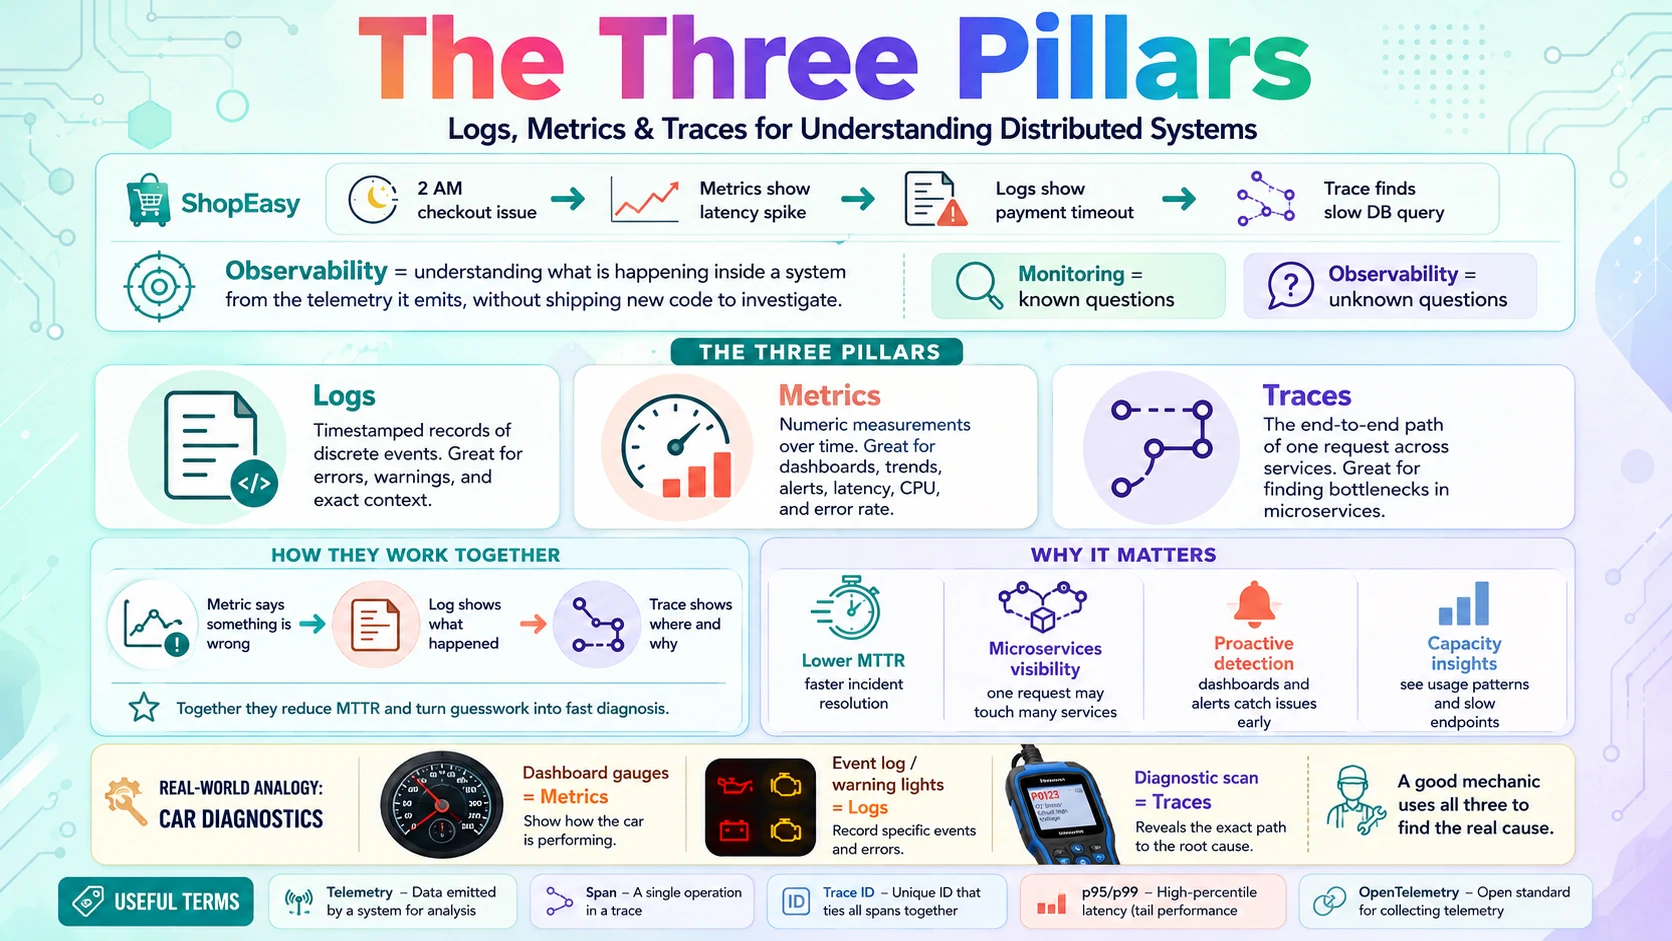
Observability rests on three kinds of telemetry a system emits, each answering a different question. In this section you will learn logs — the timestamped record of individual events ("what happened?"); metrics — numeric measurements over time ("how many, how fast, how full?"); and distributed tracing — following one request as it hops across many services ("where did the time go, and which service failed?"). Together they turn a mysterious black box into something you can actually inspect and debug.
1.1 🎯 Introduction
It's 2 AM and our online store ShopEasy is throwing errors at checkout. The servers are running, CPU looks normal, yet customers can't pay. Without observability you're blind — reduced to guessing and restarting things. With it, you pull up a dashboard, see checkout latency spiked at 01:58, search the logs for errors at that moment, follow a trace of one failed checkout across services, and discover the payment service is timing out on a slow database query. Diagnosis in minutes, not hours.
Observability is the ability to understand what's happening inside a system just from the data it emits from the outside — without shipping new code to investigate. It's often confused with monitoring; the difference is subtle but useful:
- Monitoring — watching known problems: "is CPU above 90%? is the site up?" You decide in advance what to check.
- Observability — being able to answer new, unknown questions after the fact: "why were checkouts from mobile users in Europe slow between 01:58 and 02:05?" You didn't predict that question, but the data lets you answer it.
Observability is built on three kinds of data, the three pillars: logs (a record of discrete events), metrics (numbers measured over time), and traces (the path of a single request across services). Each answers a different question, and you need all three to see the whole picture.
💡 Monitoring tells you something is wrong; observability tells you why. Monitoring watches the questions you knew to ask; observability lets you ask brand-new questions when something unexpected breaks — which is most of the time.
1.2 💡 Why It Matters
In a modern system spread across dozens or hundreds of services, failures are inevitable and rarely obvious. Observability is what keeps MTTR (mean time to recovery, from the reliability post) low — and MTTR is a huge part of availability. The scale is real: companies like Netflix and Uber ingest trillions of log lines and metric data points per day, and teams that practice good observability resolve incidents in minutes while blind teams take hours. When you're losing revenue every minute you're down, that gap is enormous.
- Faster recovery (lower MTTR) — you can't fix what you can't see. Observability turns "something's wrong somewhere" into "the payment service's DB query is slow" in minutes.
- Microservices make it essential — one user request may touch 20 services; without tracing, finding which one failed is nearly impossible.
- Catch problems before users do — metrics and alerts surface a rising error rate or latency creep before it becomes an outage.
- Understand behaviour, not just failures — observability also reveals usage patterns, slow endpoints, and capacity trends that guide scaling and design.
Why system design cares: a design isn't complete at "it works" — you must be able to operate it. Every serious system needs an answer to "how will you know when this breaks, and how will you debug it?" The answer is the three pillars feeding dashboards and alerts.
1.3 🏠 Real-world Analogy
Think of a car's instruments and records. The dashboard gauges — speed, fuel, engine temperature, RPM — are your metrics: continuous numbers that tell you at a glance how things are, right now, over time. The event log / warning lights — "check engine at 10:42," "door opened," "ABS activated" — are your logs: a timestamped record of specific things that happened. And when the car goes to the mechanic, the diagnostic scan that traces a fault through the whole system — from the sensor, through the engine control unit, to the specific failing part — is distributed tracing: following one problem across every connected component to find where it actually went wrong.
You need all three. Gauges show a temperature spike (metric) but not why; the log tells you the coolant warning fired at a moment; the diagnostic trace shows the fault started in a specific sensor feeding a specific module. Software observability works the same way — three complementary views of one running system.
| Car World | Observability World | Meaning |
|---|---|---|
| 📟 Dashboard gauges (speed, temp, fuel) | 📊 Metrics | Continuous numbers over time |
| 📋 Event log & warning lights | 📝 Logs | Timestamped record of what happened |
| 🔧 Diagnostic scan tracing a fault | 🔗 Distributed tracing | Follow one issue across components |
| 🌡️ "Temperature is high" (but not why) | ❓ Metric shows symptom | Tells you something is wrong |
| 🔎 "Fault began at this sensor" | 🎯 Trace/log show cause | Tells you where and why |
A good mechanic doesn't rely on one gauge — they read the dashboard, check the logs, and run a diagnostic trace. Observability gives your system the same three instruments so you can go from "something's wrong" to "here's the exact cause."
1.4 📖 Key Terms
| Term | Simple Definition | Quick Example |
|---|---|---|
| Observability | Understanding a system's internals from the data it emits | Debugging without adding new code |
| Telemetry | The data a system emits about itself | Logs, metrics, traces |
| Log | A timestamped record of a discrete event | "12:01 ERROR payment timeout" |
| Structured log | A log in machine-readable form (JSON) | {"level":"error","order":1001} |
| Metric | A numeric measurement tracked over time | Requests/sec, error rate, CPU % |
| Time-series | Metric values stamped with time | Latency each minute |
| Trace | The full path of one request across services | One checkout across 5 services |
| Span | One step/operation within a trace | The DB query part of a trace |
| Trace ID | Shared ID that links all spans of one request | Correlate logs across services |
| Cardinality | Number of distinct label values on a metric | High = expensive to store |
| Percentile (p95/p99) | The value below which X% of samples fall | p99 latency = worst 1% experience |
| OpenTelemetry | The open standard for emitting telemetry | One SDK for logs/metrics/traces |
1.5 🔢 How It Works
Each pillar answers a different question. We'll take them one at a time — logs (what happened), metrics (how much/how fast), and traces (where the request went) — then see how they combine.
A. Logs — What Happened
A log is a timestamped record of a single event. Logs are the most detailed pillar — they capture specifics ("order 1001 failed: payment gateway timeout") that metrics and traces don't. Two practices make logs usable at scale:
- Structured logging — write logs as JSON (key-value fields), not free text, so machines can filter and search them. "Find all errors for user 1001" becomes a query, not a grep through millions of lines.
- Log levels — tag each line
DEBUG,INFO,WARN, orERRORso you can filter noise from signal.
Because a request touches many servers, logs are shipped to a central store (log aggregation) — you never SSH into individual machines. Note the trace_id: it's what lets you jump from a log line to the full trace of that request (pillar C). The cost of logs is volume — they're the most expensive pillar to store, so you keep only what's useful and expire old logs.
B. Metrics — How Much, How Fast
A metric is a number measured over time — a time-series. Metrics are cheap to store and perfect for dashboards and alerts because they're just numbers with timestamps. The common types:
- Counter — only goes up (total requests, total errors).
- Gauge — goes up and down (current CPU %, queue depth, active connections).
- Histogram — distribution of values, used for latency percentiles.
A hugely important habit: track percentiles, not just averages. The average hides pain — if p50 latency is 100 ms but p99 is 5 seconds, 1% of users (often your heaviest) are suffering, and the average never shows it. A popular starting set is the RED metrics for every service: Rate (requests/sec), Errors (failed/sec), and Duration (latency percentiles).
📌 Averages lie; percentiles tell the truth. "Average latency is 120 ms" can hide a p99 of 4 seconds. Always alert and dashboard on p95/p99 so you see the experience of your worst-affected users, not a comforting mean. Watch cardinality too — adding high-variety labels (like user ID) to a metric explodes storage cost.
C. Distributed Tracing — Where the Request Went
In a microservices system, one user action fans out across many services. When it's slow or fails, metrics say "checkout is slow" and logs are scattered across servers — but which service caused it? Distributed tracing answers that by following a single request end to end.
It works by assigning each incoming request a unique trace ID that is propagated to every service the request touches. Each service records a span — one timed operation — tagged with that trace ID. Collected together, the spans form a waterfall showing exactly where the time went:
At a glance you see the 520 ms request spent 450 ms in the payment service, almost all of it (430 ms) in a database query — the exact cause, across service boundaries. Because tracing every request is expensive, systems usually sample (trace a fraction, or all errors/slow requests).
D. Bringing the Pillars Together
The pillars are strongest combined, and the glue is the trace ID shared across all three. A typical debugging flow uses each in turn:
| Step | Pillar | What it tells you |
|---|---|---|
| ① | 📊 Metrics | An alert fires: checkout error rate and p99 latency spiked — something is wrong |
| ② | 🔗 Traces | Open a slow trace: the time is in the payment service's DB span — where it's wrong |
| ③ | 📝 Logs | Filter logs by that trace ID: "connection pool exhausted" — why it's wrong |
Metrics tell you something is wrong, traces tell you where, logs tell you why. Emitting all three in a consistent way is easiest with OpenTelemetry — an open standard (SDKs + collector) for producing logs, metrics, and traces once and sending them to any backend, so you're not locked into one vendor.
1.6 🔀 Types & Variations
The three pillars are the core "types" of telemetry, each with a distinct shape, cost, and best use. A newer fourth signal — events / profiles — is emerging, but logs, metrics, and traces are the foundation.
Logs
Timestamped records of discrete events. Most detailed; most expensive to store.
- Answers: what happened
- Best for: root-cause detail
Metrics
Numeric time-series. Cheap, fast, perfect for dashboards and alerts.
- Answers: how much / how fast
- Best for: trends, alerting
Traces
The path of one request across services, as timed spans.
- Answers: where the time/failure went
- Best for: microservice debugging
Use the right pillar for the question. "Is the error rate rising?" → metrics. "Which service is slow for this request?" → traces. "What exactly went wrong in that request?" → logs. They overlap deliberately — the trace ID lets you pivot from one to another mid-investigation.
1.7 🎨 Illustrated Diagram
The diagram shows the observability data flow: services emit all three signals, a collector ships them to their stores, and engineers view them together in one place — where a shared trace ID lets them pivot between metrics, traces, and logs.
Reading the diagram: your services emit logs, metrics, and traces to a collector (a single agent, typically OpenTelemetry), which routes each signal to the right store. Engineers view all three in one dashboard — and because every signal carries the same trace ID, they can jump from a spiking metric to the exact trace to the precise log line without switching tools.
1.8 ✅ When to Use
Some observability is non-negotiable for anything in production; how deep you go scales with the system's size and criticality. And each pillar earns its place for different questions.
| You need to answer… | Reach for… |
|---|---|
| "Is the system healthy? Is a rate/latency trending badly?" | Metrics (dashboards + alerts) |
| "Which service in the chain is slow or failing?" | Traces |
| "What exactly happened in this one failed request?" | Logs |
| "What's the experience of my worst 1% of users?" | Metrics — p95/p99 percentiles |
| Invest heavily (all three, high retention) when… | Keep it lean when… |
|---|---|
| You run microservices or high-traffic, revenue-critical systems | It's a small single-service app or a prototype |
| Fast incident recovery (low MTTR) is essential | Downtime is low-impact and rare |
| You must debug problems you can't reproduce locally | Basic metrics + logs already answer your questions |
Rule of thumb: start with metrics + logs for every service from day one (cheap, high value), add distributed tracing once you have multiple services, and always dashboard/alert on percentiles, not averages. Mind the cost — sample traces and expire old logs so observability doesn't cost more than the system it watches.
1.9 🏗️ Real-world Example — Debugging ShopEasy's 2 AM Checkout Failure
The exact incident from the intro, now solved with the three pillars working together:
| Step | Pillar | What Happens |
|---|---|---|
| ① | 📊 Metrics | The checkout error rate jumps from 0.1% to 12% and p99 latency hits 8 s — the on-call engineer knows something broke, and roughly when (01:58) |
| ② | 📊 Metrics | Dashboards show CPU, memory, and traffic all normal — so it's not load; the problem is deeper |
| ③ | 🔗 Trace | Opening a slow checkout trace shows 450 ms of a 520 ms request inside the payment service's database span — the "where" |
| ④ | 📝 Logs | Filtering logs by that trace ID reveals ERROR: connection pool exhausted in the payment service — the "why" |
| ⑤ | 🔎 Root cause | A deploy at 01:57 shrank the DB connection pool; under normal traffic it ran out, so queries queued and timed out |
| ⑥ | ✅ Fix & confirm | Roll back the deploy; within a minute the metrics show error rate and p99 back to normal — verified, not guessed |
The payoff: from alert to root cause to fix in minutes, because metrics found when/that, the trace found where, and logs found why — all linked by one trace ID. Without observability this is a multi-hour outage of blind restarts; with it, it's a quick, confident rollback confirmed by the same dashboards that raised the alarm.
1.10 ⚖️ Trade-offs
Observability is essential, but telemetry has real cost and can become noise if unmanaged. The trade-offs:
| ✅ Advantages | ❌ Costs |
|---|---|
| Fast debugging — root cause in minutes, low MTTR | Storage cost — logs/traces at scale can be very expensive |
| Catch issues early — trends surface before outages | Performance overhead — emitting telemetry uses CPU/network (usually small) |
| Works across microservices — tracing spans the whole request | Data overload — too much telemetry hides the signal in noise |
| Vendor-neutral — OpenTelemetry avoids lock-in | Setup effort — instrumentation, collectors, and pipelines to run |
| Insight beyond failures — usage & capacity trends | Cardinality traps — high-variety labels explode metric cost |
📌 The core tension: more telemetry means more insight and more cost and noise. The goal isn't to log everything — it's to capture the useful signals (RED metrics, errors, sampled traces, structured logs) and expire the rest, so observability pays for itself in faster recovery rather than becoming its own budget problem.
1.11 🚫 Common Mistakes
| # | ❌ Common Mistake | ✅ The Reality |
|---|---|---|
| 1 | Alerting/dashboarding on averages | The average hides the pain of your worst users. Track and alert on p95/p99 percentiles, not the mean. |
| 2 | Only logs, no metrics or traces | Logs alone can't show trends or cross-service latency. Use all three pillars — each answers a different question. |
| 3 | Unstructured, un-centralised logs | Free-text logs on individual servers are un-searchable at scale. Use structured (JSON) logs shipped to a central store. |
| 4 | No trace ID linking the pillars | Without a shared trace ID you can't pivot from a metric to the trace to the log. Propagate one ID through every service. |
| 5 | Logging everything forever | Unbounded telemetry balloons cost and buries the signal. Sample traces, set log levels, and expire old data. |
| 6 | High-cardinality labels on metrics | Adding user IDs or request IDs as metric labels explodes storage. Keep metric labels low-cardinality; put high-variety detail in logs/traces. |
1.12 📝 Summary
- Observability = understand the inside from the outside — answer new questions about a running system; monitoring watches known ones, observability explains the unknown.
- Logs — what happened — timestamped events; structured (JSON) and centralised, the most detailed but costliest pillar.
- Metrics — how much / how fast — cheap numeric time-series; alert on RED (rate, errors, duration) and always on p95/p99, not averages.
- Traces — where the request went — a trace ID + spans follow one request across services to pinpoint the slow or failing one.
- Together via a shared trace ID — metrics find that, traces find where, logs find why; OpenTelemetry emits all three vendor-neutrally.
1.13 🏋️ Design Challenge
🍔 Challenge: Add observability to a food-delivery app
A food-delivery app spans many services (ordering, restaurant, payment, driver-tracking). Users complain that "the app is slow sometimes," but you can't reproduce it. Think through the following:
- Which pillar do you check first to confirm and locate the slowness?
- "Average latency looks fine" — why might users still be suffering, and what should you measure instead?
- How do you pinpoint which of the many services is the bottleneck for a slow order?
- Once you find the culprit service, how do you learn the exact cause?
👁️ Show Answer
First pillar: metrics — dashboard the RED metrics (rate, errors, duration) per service to confirm the slowness is real and see which endpoints/services show elevated latency and when.
Average vs percentiles: a fine average can hide a terrible p99 — "sometimes slow" is the classic signature of a bad tail. Measure p95/p99 latency; you'll likely find 1–5% of orders are very slow while the average looks healthy.
Which service: use distributed tracing. Pull a slow order's trace and read the span waterfall — it shows exactly which service (say driver-tracking) consumed most of the time, across all the hops.
Exact cause: filter logs by that request's trace ID in the culprit service to read the specific errors/warnings (e.g. a slow geo-query or an exhausted connection pool). Metrics → traces → logs = that → where → why.
1.14 ☁️ Cloud Service Mapping
Each cloud has a managed service per pillar, and popular open-source / third-party tools cover the same ground:
| Pillar | AWS (Primary) | GCP | Azure |
|---|---|---|---|
| Logs | CloudWatch Logs | Cloud Logging | Azure Monitor Logs |
| Metrics | CloudWatch Metrics | Cloud Monitoring | Azure Monitor Metrics |
| Traces | AWS X-Ray | Cloud Trace | Application Insights |
Simplest picture: instrument your services with OpenTelemetry (one vendor-neutral SDK for all three pillars), and ship the data to your cloud's stack — e.g. AWS CloudWatch (logs + metrics) plus X-Ray (traces). Popular alternatives combine the pillars too: Prometheus + Grafana (metrics/dashboards), the ELK stack (logs), Jaeger (traces), or all-in-one platforms like Datadog and Grafana Cloud.
🔔 2. Alerting & Automation
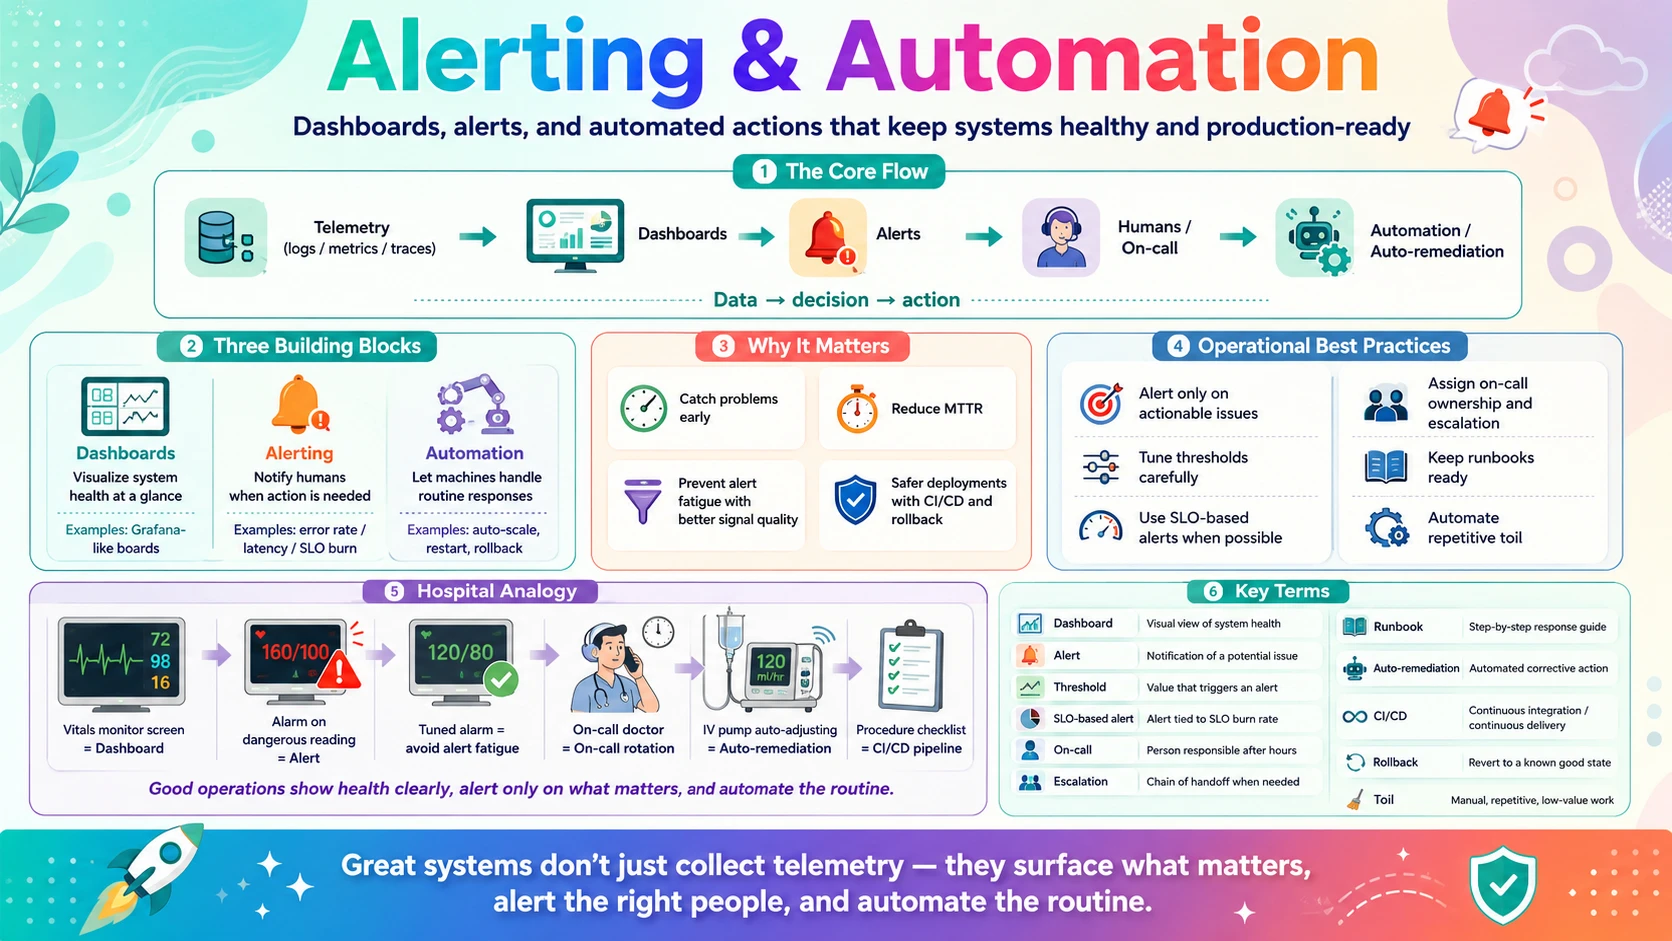
The three pillars produce a flood of data — but data no one looks at helps no one. This section is about turning telemetry into action. You will learn how dashboards make the system's health visible at a glance, how alerts page a human only when something genuinely needs attention (and how to avoid drowning them in noise), how SLO-based alerting and on-call practices keep the right people informed, and how automation — from auto-remediation to CI/CD pipelines — reduces the manual toil that causes outages in the first place.
2.1 🎯 Introduction
The three pillars give ShopEasy a flood of logs, metrics, and traces. But nobody watches dashboards 24/7, and staring at graphs won't catch a problem at 3 AM. The missing piece is turning that data into action: a screen that surfaces health at a glance, an automatic nudge when something crosses a line, and machinery that fixes routine problems without waking anyone. That's alerting and automation.
Three ideas work together here:
- Dashboards — visualisations of your metrics (and logs/traces) so a human can see system health at a glance and investigate during an incident.
- Alerting — rules that watch the telemetry and automatically notify a human when something needs attention — ideally before users are affected, and only when action is truly required.
- Automation — letting machines handle the routine: auto-scaling and auto-remediation for known problems, and CI/CD pipelines that build, test, and deploy safely so humans don't do error-prone manual steps.
The north star is a system that mostly runs itself, tells you the moment it can't, and gives you the tools to fix it fast. Get alerting wrong and you either miss outages or bury your team in noise until they ignore everything — so the craft is alerting on what matters, and automating away the rest.
💡 Data → decision → action. Observability collects the data; dashboards turn it into understanding; alerts turn thresholds into notifications; automation turns known responses into no-human-needed fixes. Each step reduces how much a tired human has to do at 3 AM.
2.2 💡 Why It Matters
Good alerting and automation are the difference between finding out about an outage from your dashboard versus from angry customers on social media. The stakes are concrete: teams that alert well catch issues in the first minutes; teams drowning in noisy alerts suffer alert fatigue and start ignoring pages — and the one real alert gets missed. Meanwhile, a huge share of outages are caused by manual changes and deploys, which is exactly what CI/CD automation makes safer and repeatable.
- Catch problems first — a good alert fires before most users notice, turning a potential outage into a quiet fix.
- Protect the humans — alerting only on what's actionable prevents burnout and keeps the team responsive to the alerts that count.
- Lower MTTR — dashboards and runbooks (and auto-remediation) get responders from "paged" to "fixed" faster, directly improving availability.
- Fewer self-inflicted outages — CI/CD replaces risky manual deploys with automated build → test → deploy, with easy rollback when something slips through.
Why system design cares: operating a system is part of designing it. A complete design says not just "here's the architecture" but "here's how we'll know it's healthy (dashboards), how we'll be told when it isn't (alerts on SLOs), and how we ship changes safely (CI/CD)." That operational story is what makes a design production-ready.
2.3 🏠 Real-world Analogy
Think of a hospital patient monitor. The screen showing heart rate, blood pressure, and oxygen is the dashboard — staff glance at it to see the patient's state. The machine doesn't expect a nurse to watch it every second; instead, if a reading crosses a safe threshold, it sounds an alarm — that's an alert. Crucially, it's tuned: it beeps for a real emergency, not every tiny fluctuation, because an alarm that cries wolf constantly gets muted (alert fatigue). And some responses are automated — an IV pump adjusts a drip within set limits without calling anyone.
The hospital also has an on-call rota: a specific doctor is responsible tonight, with clear escalation if they don't respond. And routine, error-prone tasks follow strict checklists so nothing is forgotten — the medical equivalent of a CI/CD pipeline that runs the same safe steps every time.
| Hospital | Ops World | Meaning |
|---|---|---|
| 🖥️ Vitals monitor screen | 📊 Dashboard | System health at a glance |
| 🚨 Alarm when a vital crosses a limit | 🔔 Alert | Notify a human when action is needed |
| 🔇 Tuned so it doesn't cry wolf | 🎯 Alert tuning (avoid fatigue) | Alert only on what's actionable |
| 👩⚕️ Tonight's on-call doctor + escalation | 📟 On-call rotation | Clear ownership of who responds |
| 💉 IV pump auto-adjusting the drip | 🤖 Auto-remediation | Machine handles the routine fix |
| 📋 Strict procedure checklists | 🚀 CI/CD pipeline | Same safe steps, every time |
A good hospital doesn't rely on someone staring at every monitor — it shows vitals clearly, alarms only on what matters, assigns clear responsibility, and automates the routine. Operating software well uses exactly the same playbook.
2.4 📖 Key Terms
| Term | Simple Definition | Quick Example |
|---|---|---|
| Dashboard | A visual view of key metrics/logs | A Grafana board of RED metrics |
| Alert | An automatic notification when a rule trips | "Error rate > 5% for 5 min" |
| Threshold | The value that triggers an alert | CPU > 90% |
| Alert fatigue | So many alerts that people ignore them | Muting a noisy channel |
| SLO-based alert | Alert when the error budget burns too fast | Burn-rate alert on an SLO |
| On-call | The person responsible for responding now | A weekly on-call rotation |
| Escalation | Passing an unacknowledged alert up the chain | Page the backup after 10 min |
| Runbook | Documented steps to handle an incident | "If queue backs up, do X" |
| Auto-remediation | Automated fix for a known problem | Auto-restart a crashed pod |
| CI/CD | Automated build/test (CI) + deploy (CD) | Merge → tests → deploy |
| Rollback | Reverting to the last good version fast | Undo a bad deploy in 1 click |
| Toil | Repetitive manual work that should be automated | Hand-editing configs each deploy |
2.5 🔢 How It Works
Four pieces turn telemetry into a system that mostly runs itself: dashboards to see it, alerts to be told about it, on-call to respond, and automation (CI/CD + remediation) to prevent and fix routine issues.
A. Dashboards
A dashboard turns raw metrics into a picture a human can read in seconds. Good ones are layered: a high-level overview (are we healthy overall?) and per-service boards with the RED metrics (rate, errors, duration) from the last sub-topic. The golden rule is that dashboards show symptoms users feel — error rate, latency percentiles, checkout success — near the top, with resource metrics (CPU, memory) below to help explain them.
Dashboards are for humans investigating, not for catching problems — nobody watches them around the clock. That job belongs to alerts, which watch the same metrics automatically.
B. Alerting Done Right
An alert is a rule over your telemetry that notifies a human when it trips. A basic threshold alert looks like this:
Three habits separate useful alerting from noise:
- Alert on symptoms, not causes — page on "checkout error rate is high" (what users feel), not on "CPU is 85%" (which may be totally fine). High CPU isn't a problem unless it hurts users.
- Require duration, use severities — fire only after a condition holds for a few minutes (avoids flapping), and split alerts into page (wake someone) vs ticket/notify (look at it tomorrow). Not everything deserves a 3 AM page.
- SLO burn-rate alerts — instead of arbitrary thresholds, alert when you're burning your error budget (from the reliability post) too fast. This ties alerts directly to user impact and is the modern best practice.
⚠️ Alert fatigue is the silent killer. Too many low-value alerts train people to ignore them — and the one real alert gets missed. Every alert should be actionable: if there's nothing a human must do, it's a dashboard metric or a ticket, not a page. Fewer, better alerts beat more alerts.
C. On-Call & Incident Response
When a page fires, someone has to act — so teams run an on-call rotation: a schedule naming who is responsible right now, so there's never confusion about who responds. Around it sit a few practices that keep response fast and humane:
- Escalation policy — if the primary on-call doesn't acknowledge within, say, 10 minutes, the alert automatically escalates to a backup, then a manager. No alert falls through the cracks.
- Runbooks — each alert links to documented steps ("if the queue backs up, do X, check Y"), so even a half-awake responder knows the first moves.
- Blameless post-mortems — after an incident, write up what happened and why, focusing on fixing the system (add an alert, automate the fix) rather than blaming a person. This is how MTTR shrinks over time.
Tools like PagerDuty or Opsgenie handle the rotation, paging, and escalation; the goal is that the right person is reached quickly and has everything they need to act.
D. Automation & CI/CD
The best incident is the one no human has to handle. Automation covers two fronts. For running systems, auto-remediation and auto-scaling handle known conditions without a page — restart a crashed process, add servers when load rises, fail over a dead node (the reliability patterns from Part 9). For changes, CI/CD replaces risky manual deploys with an automated pipeline:
Two techniques make the prod deploy safe: canary releases send the new version to a small slice of traffic first and watch its metrics before rolling out fully, and blue-green keeps the old version ready so a bad deploy can be reverted instantly. This closes the observability loop — the same metrics that alert you also gate and roll back deployments, so a broken change is caught and undone automatically instead of becoming an outage.
📌 Automation turns telemetry into a self-healing loop: emit metrics → alert on symptoms → auto-remediate the known cases → for changes, let CI/CD deploy gradually and auto-rollback on bad metrics. Humans are paged only for the genuinely novel problems — which is exactly where humans are needed.
2.6 🔀 Types & Variations
A key part of automation is how you deploy — the strategy decides how safely a new version reaches users and how fast you can undo a bad one. These are the common ones.
Rolling
Replace servers with the new version a few at a time. Simple, no extra fleet — but a rollback is another slow roll.
Blue-Green
Run two full environments; switch all traffic to the new one, keep the old ready. Instant rollback — at the cost of double infrastructure.
Canary
Send the new version to a small % of traffic, watch its metrics, then ramp up. Catches bad releases before they hit everyone.
Feature Flags
Ship code dark and turn features on/off at runtime — decoupling deploy from release, and enabling instant kill-switches.
They pair with observability. Canary and blue-green are only safe because you're watching metrics during the rollout — the pipeline promotes or rolls back based on error rate and latency. Deployment strategy + monitoring + auto-rollback together are what let mature teams deploy many times a day with confidence.
2.7 🎨 Illustrated Diagram
The diagram shows the response loop. Metrics feed both a dashboard (for humans) and an alerting engine. When a rule trips, known problems are auto-remediated with no page; novel ones page the on-call engineer, who uses the dashboard and runbook to fix it — and feeds the lesson back into better automation.
Reading the diagram: metrics power both the dashboard and the alerting engine. Known problems take the left path — auto-remediated, no human woken. Only novel problems page the on-call engineer, who leans on the dashboard and runbook to resolve them; the post-mortem then turns that novel case into new automation (the dotted line), so next time it's handled without a page.
2.8 ✅ When to Use
The key judgement is what deserves a page versus a dashboard or a ticket, and what to automate versus leave to a human.
| Page a human (wake them up) when… | Don't page — dashboard or ticket — when… |
|---|---|
| Users are affected or about to be (error/latency SLO burning) | A resource is high but users are fine (e.g. CPU 85%) |
| A human must act now, and it can't be automated | It's informational or can wait until working hours |
| A critical dependency (payments, DB) is failing | It's a transient blip that self-recovers |
| The problem is novel / not yet automated | A known issue that auto-remediation already handles |
And where to invest in automation:
| Situation | Reach for… |
|---|---|
| Deploys are manual, risky, or infrequent | CI/CD pipeline with automated tests + rollback |
| The same manual fix happens repeatedly (toil) | Auto-remediation (script the known response) |
| Load varies through the day | Auto-scaling (from the scalability post) |
| A risky release to many users | Canary / blue-green with metric-gated promotion |
| Alerts tie to user impact, not arbitrary numbers | SLO burn-rate alerting |
Rule of thumb: alert only on actionable, user-facing symptoms — everything else is a dashboard metric or a ticket. Automate any response you've done manually more than a couple of times, and never deploy to production without an automated pipeline that can roll back. Fewer pages, more automation.
2.9 🏗️ Real-world Example — ShopEasy Ships a Bad Deploy Safely
A developer merges a change that accidentally slows checkout. Watch alerting and automation contain it before most users ever notice:
| Step | Event | Alerting / Automation at work |
|---|---|---|
| ① | The change is merged | 🚀 CI/CD builds it, runs tests (they pass — the bug is a runtime slowdown), and deploys to staging then prod |
| ② | Prod rollout begins | 🐤 Canary — only 5% of traffic gets the new version first |
| ③ | Checkout p99 latency on the canary jumps | 📊 The pipeline is watching metrics and sees the canary is worse than baseline |
| ④ | Automatic decision | ↩️ Auto-rollback — the canary is pulled; 95% of users never saw the bad version |
| ⑤ | A separate node crashes overnight | 🤖 Auto-remediation restarts it; no page, because it's a known, handled case |
| ⑥ | A genuinely novel error spikes checkout failures | 🔔 SLO burn-rate alert pages the on-call engineer (error budget burning fast) |
| ⑦ | On-call responds | 🖥️ Uses the dashboard + runbook to fix it, then writes a blameless post-mortem → adds automation so next time it's handled |
The payoff: a bad deploy was caught by canary metrics and rolled back automatically (steps ②–④), a routine crash self-healed (⑤), and a human was paged only for the one truly novel problem (⑥–⑦) — which then became automation for next time. That's a system that mostly runs itself and asks for help only when it genuinely needs a human.
2.10 ⚖️ Trade-offs
Alerting and automation dramatically improve operations, but both can be over- or under-done. The trade-offs:
| ✅ Advantages | ❌ Costs / risks |
|---|---|
| Fast response — problems caught in minutes, low MTTR | Alert fatigue — too many alerts and people tune them out |
| Fewer humans woken — automation handles the routine | Automation can misfire — a bad auto-action can worsen an incident |
| Safer deploys — CI/CD + canary + rollback | Setup & upkeep — pipelines, rules, and runbooks to build and maintain |
| Consistency — the same safe steps every time | Over-automation risk — automating a rare task can cost more than it saves |
| Continuous improvement — post-mortems feed better automation | On-call burden — being on-call is stressful; must be humane and rotated |
📌 The core tension: too few alerts miss outages; too many cause fatigue. Too little automation means toil and manual errors; too much can act wrongly at scale. The sweet spot is alert only on actionable user impact and automate the well-understood, frequent responses — leaving humans for the novel judgement calls.
2.11 🚫 Common Mistakes
| # | ❌ Common Mistake | ✅ The Reality |
|---|---|---|
| 1 | Alerting on everything | A flood of alerts causes fatigue and the real one gets missed. Alert only on actionable, user-facing symptoms; make the rest dashboards or tickets. |
| 2 | Alerting on causes, not symptoms | "CPU 85%" may be fine; page on "checkout error rate high" or SLO burn-rate — what users actually feel. |
| 3 | Non-actionable alerts | If a page has no clear response, it's noise. Every alert needs a runbook and a reason to wake someone. |
| 4 | Manual, un-automated deploys | Hand-deploys are a top cause of outages. Use CI/CD with automated tests and one-click (or automatic) rollback. |
| 5 | No rollback plan | Deploying with no fast way back turns a bad release into a long outage. Always keep the last good version instantly restorable. |
| 6 | Blaming people in post-mortems | Blame hides the real (systemic) cause and stops people being honest. Run blameless post-mortems that fix the system, not the person. |
2.12 📝 Summary
- Turn telemetry into action — dashboards make health visible; alerts notify humans; automation handles the routine.
- Alert on symptoms, not causes — page on user-facing impact (errors, latency, SLO burn-rate), require a duration, and split page vs ticket.
- Avoid alert fatigue — every alert must be actionable; fewer, better alerts beat a noisy flood.
- On-call with escalation, runbooks, blameless post-mortems — clear ownership and continuous improvement shrink MTTR.
- Automate deploys and known fixes — CI/CD with tests, canary/blue-green, and auto-rollback; auto-remediate repeat toil, page humans only for novel problems.
2.13 🏋️ Design Challenge
📟 Challenge: Set up alerting & deploys for a SaaS API
You run a SaaS API with a 99.9% SLA. The team is drowning in alerts and does risky manual deploys on Friday afternoons. Think through the following:
- Which few things should actually page someone, and which should just be dashboards/tickets?
- How do you tie alerts to the 99.9% SLA rather than arbitrary thresholds?
- How do you make deploys safe enough to do any day, not just when everyone's watching?
- A specific node keeps crashing weekly and someone manually restarts it. What should you do?
👁️ Show Answer
What pages: only user-facing symptoms — elevated error rate, high p99 latency, or the API being down. High CPU/memory, disk filling slowly, and non-critical warnings become dashboard metrics or tickets, not pages. Every page must be actionable with a runbook.
Tie alerts to the SLA: use SLO burn-rate alerting. Define an SLO (e.g. 99.9% success), compute the error budget, and alert when you're burning it too fast (a fast burn pages immediately; a slow burn opens a ticket). Alerts now map directly to customer impact and the SLA.
Safe any-day deploys: a CI/CD pipeline with automated tests, deploying via canary (5% → watch metrics → ramp) or blue-green, with automatic rollback if metrics degrade. When a bad deploy is caught and reverted by the pipeline, Friday afternoon stops being scary — no more "deploy freeze."
Weekly crash: that manual restart is toil — automate it. Add auto-remediation (health check + auto-restart) so it self-heals with no page, and file a ticket to fix the root cause (write a post-mortem) so it eventually stops happening at all.
2.14 ☁️ Cloud Service Mapping
Clouds provide managed alerting, deployment pipelines, and incident tooling; dedicated third-party tools are common for paging:
| Need | AWS (Primary) | GCP | Azure |
|---|---|---|---|
| Dashboards & alerting | CloudWatch Alarms & Dashboards | Cloud Monitoring (alerting) | Azure Monitor Alerts |
| CI/CD pipelines | CodePipeline / CodeBuild / CodeDeploy | Cloud Build + Cloud Deploy | Azure Pipelines (DevOps) |
| On-call / incident response | Systems Manager Incident Manager | (via 3rd-party) | (via 3rd-party) |
Simplest AWS picture: dashboard the RED metrics in CloudWatch, set SLO-based alarms that notify via SNS, deploy through CodePipeline with canary/rollback via CodeDeploy, and route pages through Incident Manager (or popular tools like PagerDuty / Opsgenie). Open-source stacks pair Prometheus Alertmanager + Grafana with a CI tool like GitHub Actions, GitLab CI, or Argo CD.
🎉 That completes Phase 1 — Foundation Prerequisites! Across Parts 1–11 you've built up the full foundation: Networking, APIs, Core Backend, Databases, Scalability, Caching & CDN, Message Queues, Estimation, Reliability & Availability, Security, and now Observability. With these fundamentals in hand, the series moves on to Phase 2 — Core System Design Concepts, where these building blocks combine to design real systems. See the Series Roadmap for what's next.
📚 References
- Google SRE Book & SRE Workbook — The definitive treatment of SLIs/SLOs, error budgets, alerting on symptoms, and reducing toil.
- OpenTelemetry Documentation — The open standard for emitting logs, metrics, and traces from any language.
- Prometheus & Grafana Docs — Practical guides to metrics collection, alerting rules, and dashboards.
- System Design Interview (Vol. 1 & 2) — Alex Xu — Includes a "Metrics Monitoring & Alerting System" design that ties these concepts together.
- Cloud observability docs — AWS CloudWatch / X-Ray, Google Cloud Operations Suite, and Azure Monitor.