System Design Phase 1 — Part 9: Reliability & Availability
📚 Table of Contents
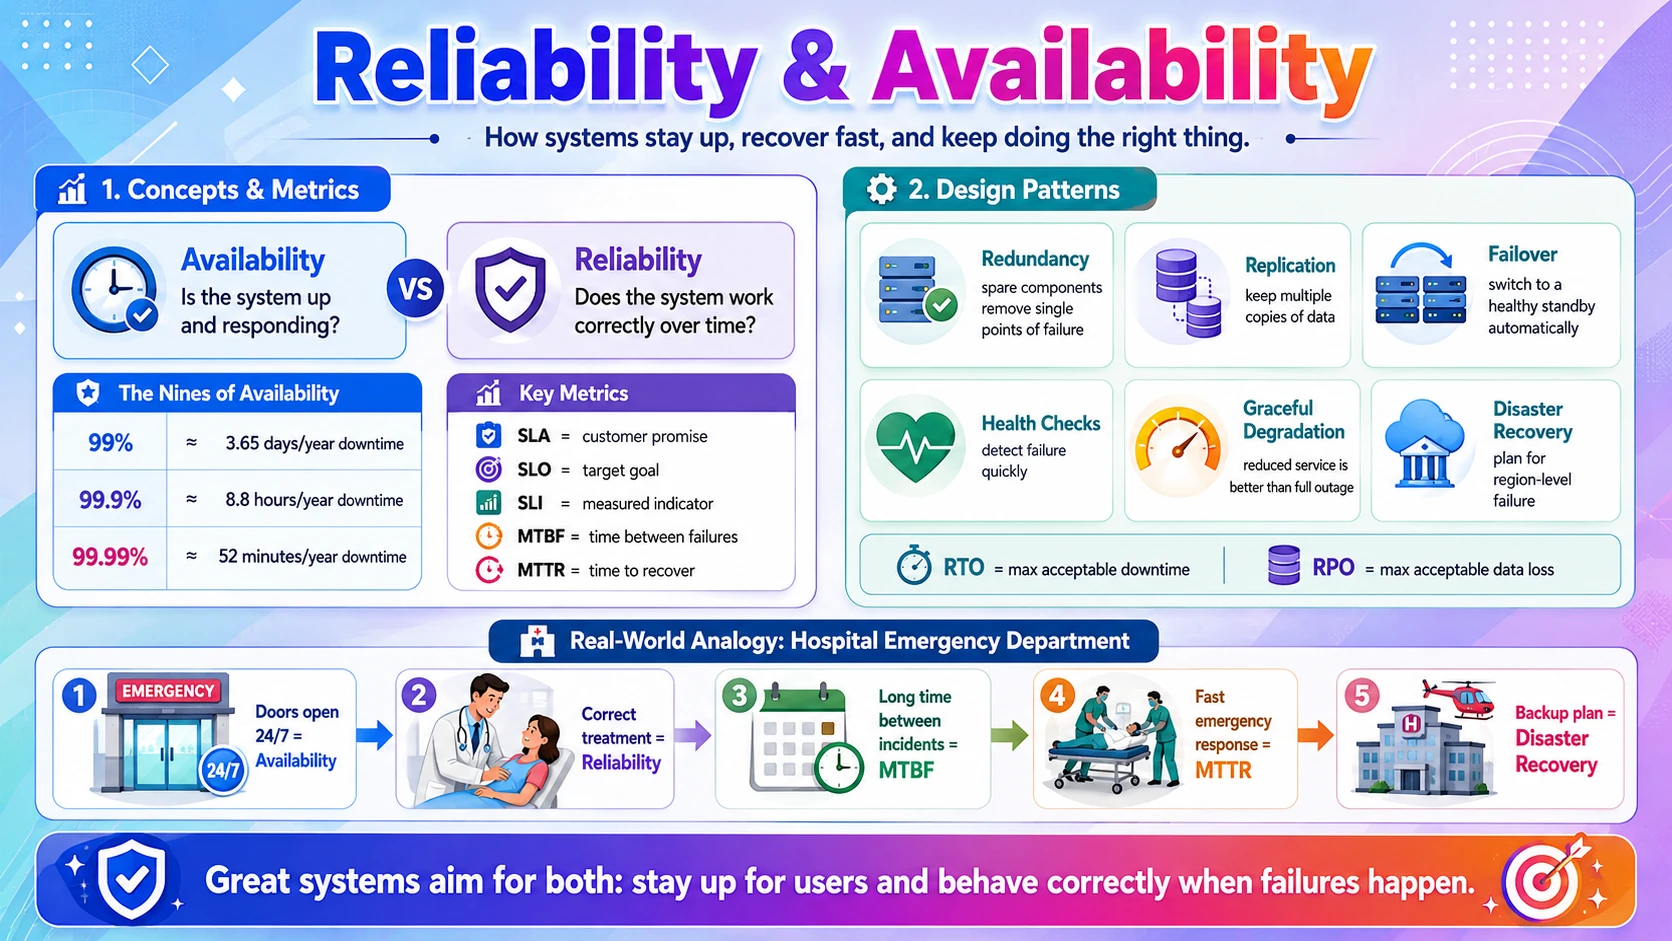
Users don't see your architecture — they see whether the app works when they open it. Reliability and availability are the properties that decide that experience, and they're what turn a clever design into one people can actually depend on. This post covers two sides. You will start with Concepts & Metrics — the difference between reliability and availability, how availability is measured in "nines," the promises captured by SLA, SLO, and SLI, and the failure-and-recovery numbers MTBF and MTTR. Then you will learn about Design Patterns — the concrete techniques that keep systems up: redundancy, data replication, failover, health checks, graceful degradation, and disaster recovery with its RTO and RPO targets. Each topic is explained with real-world analogies, step-by-step examples, and clear diagrams — starting from zero.
📊 1. Concepts & Metrics
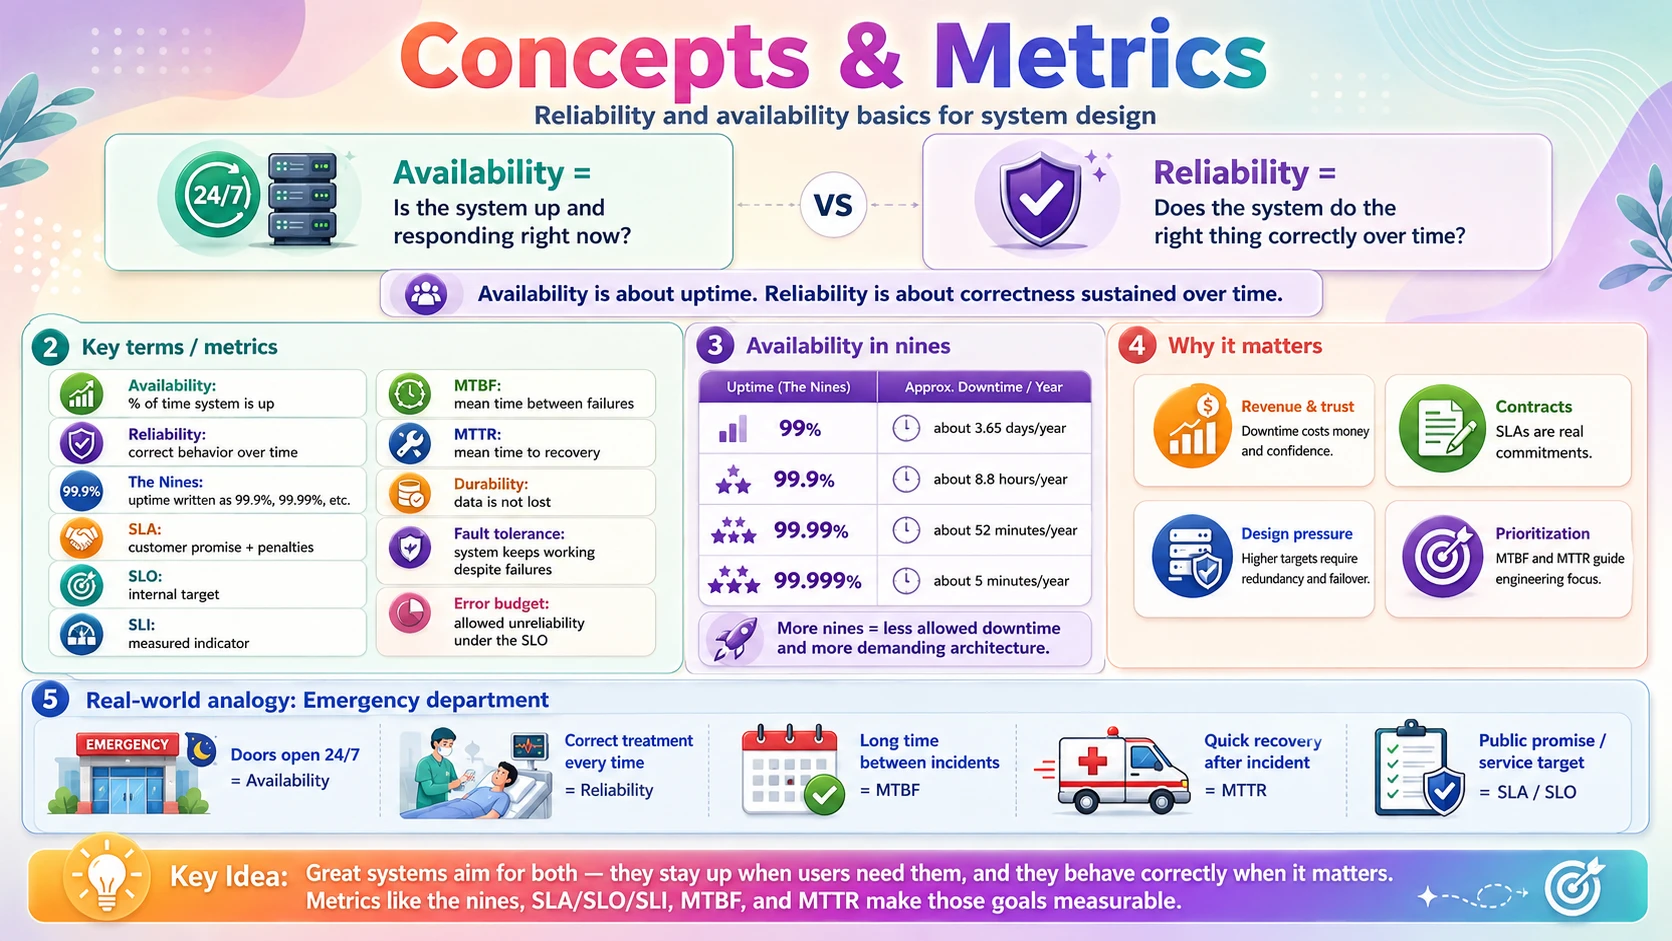
Before you can make a system dependable, you need to define and measure what "dependable" means. In this section you will learn the crucial difference between reliability (does it work correctly?) and availability (is it up right now?), how availability turns into concrete downtime through the "nines," the vocabulary of SLA / SLO / SLI that formalises those targets, and the two numbers — MTBF and MTTR — that capture how often things break and how fast you recover.
1.1 🎯 Introduction
Picture our online store ShopEasy on a normal afternoon. A shopper taps "Buy" — and the page hangs, then shows an error. To them it doesn't matter whether a server crashed, a database was slow, or a network link dropped. What matters is a single thing: it didn't work when I needed it. Reliability and availability are how we describe, measure, and promise that "it works when you need it."
These two words are used interchangeably in casual talk, but they mean different things, and the difference matters:
- Availability — is the system up and responding right now? It's about uptime. A system that answers every request, even if some answers are a little stale, is highly available.
- Reliability — does the system do the right thing, correctly, over time? It's about trustworthiness. A reliable system doesn't lose your order, double-charge you, or corrupt data — and keeps behaving correctly for long stretches.
A system can be one without the other. A cache that always answers but sometimes returns wrong data is available but not reliable. A bank system that refuses requests during maintenance rather than risk an error is reliable but not fully available. Great systems aim for both, and this section gives you the vocabulary and numbers to talk about them precisely — the "nines," SLA/SLO/SLI, MTBF, and MTTR.
💡 One-line distinction: availability asks "is it up?"; reliability asks "is it up AND doing the right thing, consistently?" Availability is a snapshot of uptime; reliability is correctness sustained over time.
1.2 💡 Why It Matters
Downtime and errors cost real money and trust. Amazon has estimated that a single hour of downtime on a peak day can cost it well over $100 million in lost sales; a major AWS or Google outage takes a slice of the internet with it and makes global news. And the difference between availability tiers is bigger than it looks: 99% availability allows 3.65 days of downtime a year, while 99.99% allows only about 52 minutes. Those extra "nines" are what customers — and contracts — pay for.
- Revenue & trust — every minute down is lost sales and eroded confidence; users who hit errors churn.
- Contracts — providers commit to availability in an SLA, often with financial penalties (service credits) if they miss it. The number isn't just marketing.
- Design pressure — a target of "four nines" forces real architectural choices: redundancy, replication, failover — the patterns in the next sub-topic. The metric drives the design.
- Prioritisation — MTBF and MTTR tell you whether to invest in preventing failures or recovering faster. Usually, recovering faster is the cheaper win.
Why system design cares: availability targets are the requirement that shapes the whole architecture. Whenever a design says "highly available," the follow-up is "how many nines, and how?" — and the honest answer is always a set of redundancy and failover patterns, sized to a measurable target.
1.3 🏠 Real-world Analogy
Think of a hospital's emergency department. Availability is whether the doors are open and staff are ready the moment you arrive — 24/7, no "closed" sign. Reliability is whether the treatment is correct every time — the right diagnosis, the right medication, no mistakes. You want both: an ER that's always open but frequently misdiagnoses is dangerous, and a brilliant ER that's closed half the time is useless.
The metrics map neatly too. MTBF (mean time between failures) is how long the ER runs smoothly between serious incidents — a well-run department goes a long time without one. MTTR (mean time to recovery) is how quickly it bounces back after an incident — backup generators kick in, a second team steps up. And the SLA is the hospital's public promise ("we will always have a doctor available within 10 minutes"), while the "nines" describe how close to always-open they really are.
| Emergency Department | System World | Meaning |
|---|---|---|
| 🚪 Doors open, staff ready 24/7 | 🟢 Availability | The system is up and responding |
| ✅ Correct diagnosis every time | 🎯 Reliability | It does the right thing, consistently |
| 📅 Long stretches with no incident | ⏱️ MTBF | How often failures happen |
| 🔧 How fast it recovers after one | 🚑 MTTR | How quickly you restore service |
| 📜 "A doctor within 10 minutes" | 📝 SLA / SLO | The promised target |
| 📈 "Open 99.99% of the time" | 🔢 The nines | Availability expressed as a percent |
A great ER minimises how often incidents happen (high MTBF) and how long they last (low MTTR), keeps the doors open (availability), and never gets the treatment wrong (reliability). Every metric in this section is one of those hospital qualities, measured for software.
1.4 📖 Key Terms
| Term | Simple Definition | Quick Example |
|---|---|---|
| Availability | Percentage of time the system is up and responding | 99.99% uptime |
| Reliability | Doing the right thing correctly over time | No lost or corrupted orders |
| Downtime | Time the system is unavailable | 52 min/year at 99.99% |
| The Nines | Availability written as a run of 9s | "four nines" = 99.99% |
| SLA | Service Level Agreement — the promise (+ penalties) | "99.9% or we credit you" |
| SLO | Service Level Objective — the internal target | Aim for 99.95% |
| SLI | Service Level Indicator — the measured number | Actual uptime = 99.97% |
| MTBF | Mean Time Between Failures — how often it breaks | Fails once every 1,000 hours |
| MTTR | Mean Time To Recovery — how fast you recover | Back up in 5 minutes |
| Durability | Data is not lost, even through failures | S3's "eleven nines" |
| Fault tolerance | Keeps working despite component failures | One server dies, users unaffected |
| Error budget | Allowed unreliability under the SLO | 0.05% downtime to "spend" |
1.5 🔢 How It Works
Let us make each idea precise: how availability and reliability differ in practice, how availability is measured and combined across components, the SLA/SLO/SLI trio that formalises targets, and the MTBF/MTTR formula that ties them together.
A. Availability vs Reliability (in Practice)
Availability is measured as a simple ratio of uptime to total time:
Reliability is subtler — it's the probability the system performs correctly over a period, captured by how rarely it fails (MTBF, below) and whether it produces correct results. A closely related idea is fault tolerance: a fault-tolerant system keeps working even when a component fails, so a single fault doesn't become downtime. High availability is usually achieved through fault tolerance — you don't prevent every failure, you make failures invisible to the user.
B. Measuring Availability — the Nines
Availability is spoken of in "nines," because each extra nine cuts allowed downtime by ~10×. Here's what each tier really permits:
| Availability | Name | Downtime/year | Downtime/month |
|---|---|---|---|
| 99% | two nines | 3.65 days | 7.31 hours |
| 99.9% | three nines | 8.77 hours | 43.83 min |
| 99.99% | four nines | 52.60 min | 4.38 min |
| 99.999% | five nines | 5.26 min | 26.30 s |
| 99.9999% | six nines | 31.56 s | 2.63 s |
The subtle part is that availability combines across components, and the direction depends on how they're wired:
- In series (a chain, each must work) — availabilities multiply, so the total is lower than any single part. Two 99% components in series: 0.99 × 0.99 = 98%. A request that passes through 5 such services drops to ~95%.
- In parallel (redundant, any one works) — you multiply the failure probabilities, so the total is higher. Two 99% components in parallel: 1 − (0.01 × 0.01) = 99.99% — two "two-nines" parts become "four nines" together.
📌 This is why redundancy works. Chaining dependencies drags availability down; running redundant copies pulls it up dramatically. Two cheap 99% servers behind a load balancer give you 99.99% — the entire next sub-topic (redundancy, replication, failover) is built on this one piece of math.
C. SLA, SLO & SLI
These three acronyms are a promise, a target, and a measurement — in that order:
- SLI (Indicator) — the actual measured number. "Over the last 30 days, uptime was 99.97%." It's the fact.
- SLO (Objective) — the internal target you aim for. "Keep availability ≥ 99.95%." It's the goal, usually stricter than the SLA.
- SLA (Agreement) — the external promise to customers, often with penalties. "We guarantee 99.9%; if we miss it, you get service credits." It's the contract.
They nest: you promise a looser SLA (99.9%) to customers, aim for a stricter SLO (99.95%) internally so you have margin, and track the real SLI to know where you stand. The gap between "perfect" and your SLO is your error budget — the small amount of downtime you're allowed to "spend." If a 99.9% SLO gives you ~43 minutes of downtime a month, that budget can be spent on risky deploys or maintenance; blow through it and you freeze changes to recover reliability.
D. MTBF & MTTR
Two numbers describe the failure lifecycle. MTBF (Mean Time Between Failures) is the average time the system runs correctly before a failure — higher is better. MTTR (Mean Time To Recovery) is the average time to restore service after a failure — lower is better. Availability falls right out of them:
The example reveals a key insight: you can raise availability either by failing less often (raise MTBF) or by recovering faster (lower MTTR). Preventing every failure is expensive and eventually impossible, so most teams get the biggest win from slashing MTTR — fast detection, automated failover, quick rollbacks. "Design for failure and recover fast" beats "try never to fail."
Availability ≠ durability. Availability is about being reachable; durability is about never losing the data once stored. A store can be briefly unavailable yet perfectly durable (your data is safe, you just can't reach it right now). Object stores like S3 advertise "eleven nines" of durability (99.999999999%) separately from their availability SLA — don't conflate the two.
1.6 🔀 Types & Variations
Availability targets come in tiers, and choosing one is a business decision — each extra nine costs more in redundancy and engineering. Match the tier to what the service actually needs.
99% — Two Nines
~3.65 days down/year.
- Internal tools, dashboards, batch jobs
- Cheap — often a single instance
99.9% — Three Nines
~8.8 hours down/year.
- Typical web apps & APIs
- Common baseline cloud SLA
99.99% — Four Nines
~52 minutes down/year.
- E-commerce, payments, SaaS
- Needs redundancy + fast failover
99.999% — Five Nines
~5 minutes down/year.
- Telecom, critical infrastructure
- Expensive — multi-region, no SPOF
Each nine is roughly 10× harder and costlier. Going from 99% to 99.9% might mean adding a standby; 99.99% needs automatic failover and redundancy everywhere; 99.999% typically requires multi-region with no single point of failure. Don't buy more nines than the service is worth — over-engineering availability is a real and common waste.
1.7 🎨 Illustrated Diagram
The diagram shows the core availability math. On the left, one server gives 99% — a single point of failure. On the right, two identical 99% servers behind a load balancer are redundant: the system is down only if both fail, which lifts availability to 99.99%.
Reading the diagram: the single server fails 1% of the time, full stop. With two in parallel, both must fail at once for an outage — 1% × 1% = 0.01% — so uptime jumps from 99% to 99.99% just by adding one machine. That leap is the whole reason the design patterns in the next sub-topic exist.
1.8 ✅ When to Use
The skill here isn't chasing the most nines — it's picking the right target and the right metric for each service. Over-provisioning availability wastes money; under-provisioning loses trust.
| Aim for high availability (more nines) when… | A lower tier is fine when… |
|---|---|
| The service is customer-facing and revenue-critical | It's an internal tool or dashboard |
| Downtime directly loses money or trust | Users tolerate occasional maintenance windows |
| An SLA with penalties is in place | Work is batch/offline and can catch up later |
| Failure is safety- or finance-critical | The cost of extra nines outweighs the benefit |
And which metric to reach for depends on the question you're answering:
| Question | Metric to use |
|---|---|
| "How much downtime can we afford?" | Availability / the nines → downtime budget |
| "What do we promise customers?" | SLA (with SLO as the stricter internal aim) |
| "How are we actually doing?" | SLI — the measured number |
| "Should we prevent or recover faster?" | MTBF vs MTTR |
| "Can we ever lose this data?" | Durability (separate from availability) |
Rule of thumb: set the SLA a notch below your internal SLO so you have margin, measure the SLI continuously, and invest in lowering MTTR before trying to raise MTBF — recovering fast is usually the cheapest path to more nines.
1.9 🏗️ Real-world Example — ShopEasy's Availability Math
ShopEasy's checkout depends on a chain of services. Let's compute the real availability, see the problem, and fix it — the numbers tell the whole story:
| Step | Situation | Availability |
|---|---|---|
| ① | A request passes through 4 services, each 99.9% available (load balancer → app → database → payment) | 0.9994 ≈ 99.6% — worse than any single part |
| ② | 99.6% sounds fine, but that's ~35 hours of downtime a year — unacceptable for checkout | Below the 99.99% goal |
| ③ | Add a redundant app server (two 99.9% in parallel) | 1 − 0.0012 = 99.9999% for that tier |
| ④ | Add a standby database with failover (two 99.9% in parallel) | ~99.9999% for the data tier |
| ⑤ | Recompute the chain with the redundant tiers | ≈ 99.99%+ end-to-end |
| ⑥ | Cut MTTR too: automated failover recovers in seconds, not the 30 min it took a human | Fewer minutes lost per incident |
What the numbers teach: chaining dependencies lowered availability to 99.6% (step ①) — a surprise that catches many designs out. Redundancy at each tier (steps ③–④) pulled it back above 99.99%, and faster recovery (step ⑥) shrank the impact of the failures that still happen. This is exactly why the next sub-topic's patterns exist: to turn that math in your favour.
1.10 ⚖️ Trade-offs
Chasing availability is worthwhile, but every extra nine has a price. Understanding the trade-offs keeps you from over- or under-investing.
| ✅ Advantages of targeting high availability | ❌ Costs |
|---|---|
| Trust & revenue — the app is there when users need it | Cost — redundancy means paying for spare, often idle, capacity |
| Meets SLAs — avoids penalties and reputational damage | Complexity — failover, replication, and health checks to build and operate |
| Measurable — nines and SLIs make goals concrete | Diminishing returns — each nine costs ~10× for less benefit |
| Resilience — survives component and even region failures | Consistency tension — staying available during partitions can mean stale data (CAP) |
| Faster recovery — low MTTR limits the damage of any failure | Operational burden — more monitoring, testing (e.g. failover drills) |
📌 The core tension: availability is bought with redundancy and complexity, and past a point each nine costs far more than it returns. The right target is a business decision — match the nines to what downtime actually costs this service, not to what sounds impressive.
1.11 🚫 Common Mistakes
| # | ❌ Common Mistake | ✅ The Reality |
|---|---|---|
| 1 | Confusing availability with reliability | A system can be up yet wrong (available, unreliable) or correct but offline (reliable, unavailable). Track and target both. |
| 2 | Ignoring how availability compounds | Four 99.9% services in a chain give only ~99.6%, not 99.9%. Dependencies multiply down — add redundancy to pull it back up. |
| 3 | Chasing more nines than needed | Each nine costs ~10× more. Match the target to what downtime actually costs; five nines on an internal tool is wasted money. |
| 4 | Only trying to prevent failures | Failures are inevitable. Investing in low MTTR (fast detection + automated recovery) usually buys more availability than chasing higher MTBF. |
| 5 | Confusing availability with durability | Being reachable and never losing data are different guarantees. A store can be briefly down yet perfectly durable — measure them separately. |
| 6 | Never testing failover | Redundancy that's never exercised often fails when needed. Run failover drills (chaos testing) so recovery works for real, not just on paper. |
1.12 📝 Summary
- Availability ≠ reliability — availability is "is it up?"; reliability is "is it up AND correct, over time?" Aim for both.
- The nines quantify downtime — 99% = 3.65 days/year, 99.99% = ~52 minutes/year; each nine is ~10× harder.
- Availability compounds — series dependencies multiply down; parallel redundancy multiplies failure away and pulls it up.
- SLA / SLO / SLI — the promise, the internal target, and the measured number; the gap to perfect is your error budget.
- Availability = MTBF / (MTBF + MTTR) — recover faster (lower MTTR) is usually the cheapest way to more nines; durability is a separate guarantee.
1.13 🏋️ Design Challenge
📈 Challenge: Set and reason about availability targets
You're defining reliability goals for a payments API. Think through the following:
- You promise customers a 99.9% SLA. What SLO should you set internally, and why not the same number?
- Your API calls 3 downstream services, each 99.95% available. Roughly what's your end-to-end availability from those dependencies alone?
- Incidents happen about once a month and take 40 minutes to resolve. Where do you invest to improve — MTBF or MTTR?
- The service is up but occasionally returns a wrong balance. Is that an availability or a reliability problem?
👁️ Show Answer
SLA vs SLO: set the internal SLO stricter than the SLA — e.g. aim for 99.95% internally while promising 99.9% externally. The gap is your safety margin (and error budget); if you only targeted 99.9%, any bad week would breach the customer promise.
End-to-end from dependencies: they're in series, so multiply: 0.99953 ≈ 99.85% — already below your 99.9% SLA before counting your own code. That's the signal you need redundancy/fallbacks on those calls (or fewer hard dependencies).
MTBF or MTTR: 40-minute recoveries are the bigger lever. Once a month × 40 min ≈ 8 hours/year of downtime. Cutting MTTR to ~4 minutes (automated detection + failover) shrinks that ~10×, far easier than eliminating monthly incidents entirely. Invest in fast recovery first.
Wrong balance: that's a reliability problem, not availability — the service is up and responding (available) but producing incorrect results (unreliable). For a payments API this is worse than downtime, and points to correctness safeguards (idempotency, validation, consistency) rather than more uptime.
1.14 ☁️ Cloud Service Mapping
Clouds publish the SLAs behind your availability numbers and give you the tools to measure SLIs and track SLOs:
| Need | AWS (Primary) | GCP | Azure |
|---|---|---|---|
| Availability SLA — the provider's commitment | AWS Service SLAs | Google Cloud SLAs | Azure SLAs |
| Monitoring / SLIs — measure uptime & errors | Amazon CloudWatch | Cloud Monitoring | Azure Monitor |
| SLO tracking — targets & error budgets | CloudWatch Application Signals | Cloud Monitoring SLOs | Azure Monitor SLOs |
Simplest picture: read the provider's SLA for the availability each service guarantees, use CloudWatch (or the equivalent) to measure your real SLI, and define an SLO with an error budget so you know when to push features versus when to freeze and shore up reliability.
🛡️ 2. Design Patterns
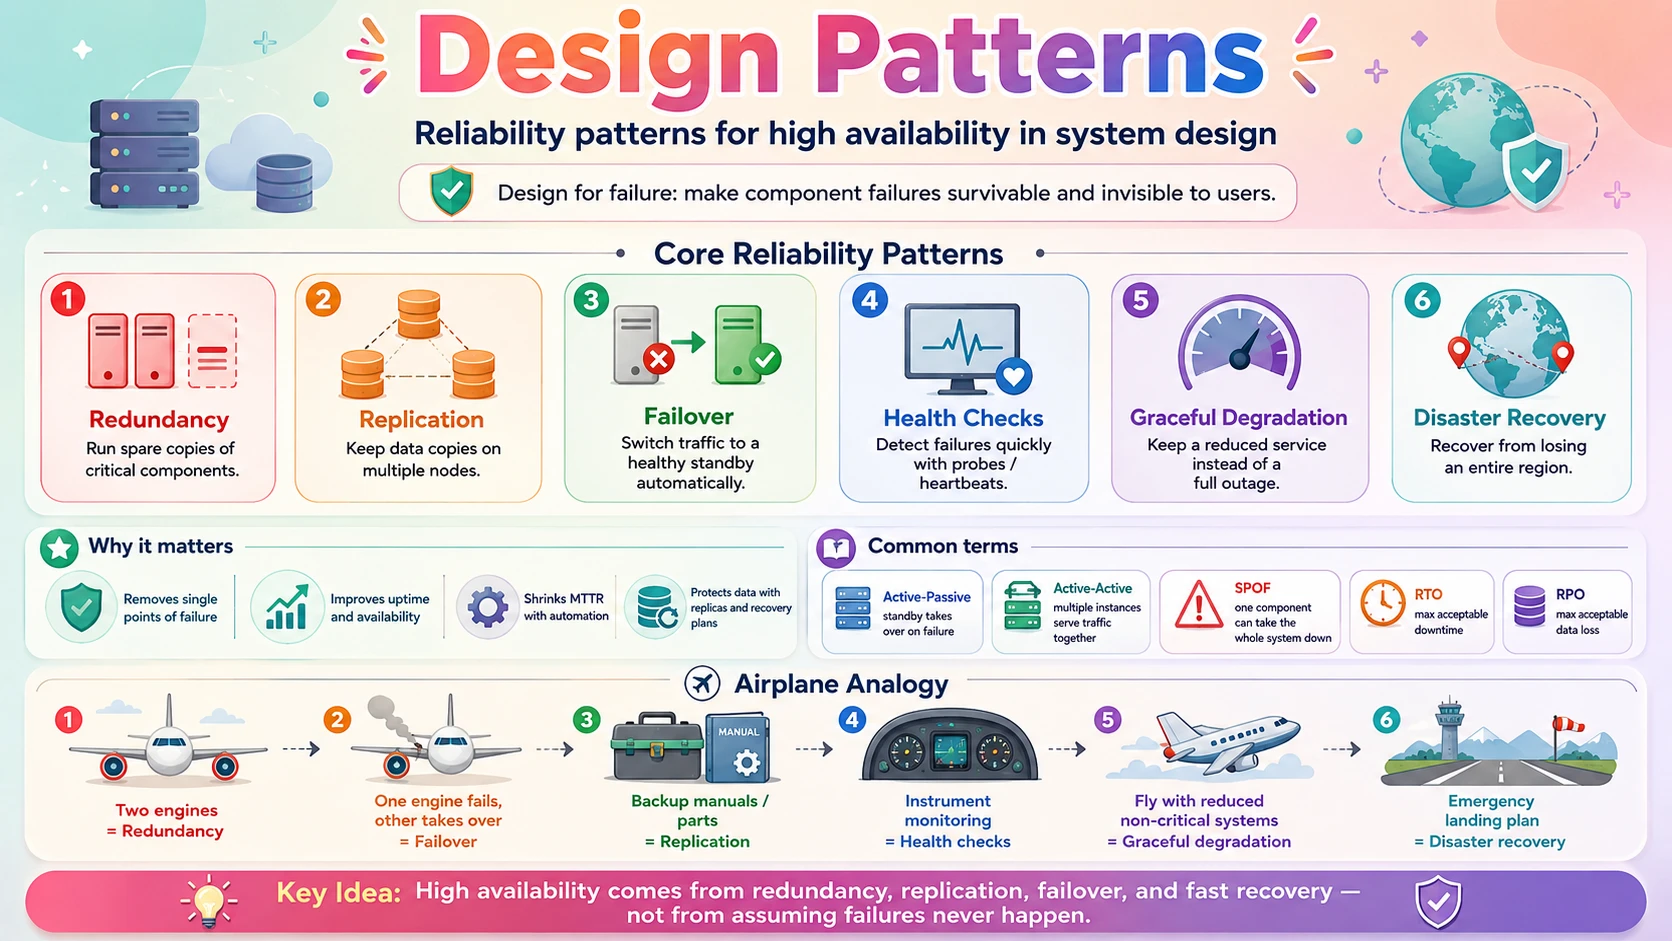
The metrics in the last sub-topic set the target; these patterns are how you hit it. The whole game is: assume everything will eventually fail, and design so that no single failure takes the system down. In this section you will learn redundancy (spare copies of every critical component), data replication (keeping data on more than one node), failover (switching to a standby automatically), health checks (detecting failure fast), graceful degradation (staying partly up instead of fully down), and disaster recovery with its RTO and RPO targets for surviving whole-region catastrophes.
2.1 🎯 Introduction
In the last sub-topic the math delivered a hard truth: ShopEasy's checkout, built as a chain of single components, could only reach ~99.6% availability — about 35 hours of downtime a year. No amount of "writing better code" fixes that, because the problem isn't bugs; it's that every physical component eventually fails. Servers crash, disks die, networks partition, and occasionally an entire data centre goes dark. Reliability design patterns accept this and engineer around it.
The guiding principle is "design for failure." Instead of trying to build components that never break, you build a system where a broken component doesn't matter — because there's another one ready to take over. That single idea expresses itself as a handful of patterns:
- Redundancy — run more than one of every critical component, so there's no single point of failure.
- Replication — keep copies of your data on multiple nodes, so losing one doesn't lose the data.
- Failover — detect a failure and switch to a healthy standby automatically, fast.
- Health checks — continuously probe components so failures are noticed in seconds, not minutes.
- Graceful degradation — when something fails, keep serving a reduced experience instead of nothing.
- Disaster recovery — a plan (and infrastructure) to recover from losing an entire region.
💡 The mindset shift: you don't achieve high availability by preventing failures — you achieve it by making failures survivable and invisible to the user. Every pattern here is a different way to remove a single point of failure or shorten recovery time (MTTR).
2.2 💡 Why It Matters
These patterns are what let real companies survive hardware that fails constantly. Google runs on millions of commodity machines where disk and server failures happen every hour — the system stays up only because redundancy and failover make each failure a non-event. Netflix famously runs "Chaos Monkey," deliberately killing production servers to prove its failover works. And when a major cloud region has an outage, the companies that stay online are precisely the ones that replicated across regions ahead of time.
- They turn the availability math around — redundancy converts two 99% components into 99.99%, exactly the leap the metrics sub-topic showed. Patterns are how you buy nines.
- They shrink MTTR — automated failover and health checks recover in seconds what would take a paged human 30+ minutes, directly raising availability.
- They protect data, not just uptime — replication is what makes losing a disk (or a data centre) survivable without losing customers' orders.
- They bound the worst case — a disaster recovery plan with RTO/RPO targets turns "we're down indefinitely" into "we're back in 15 minutes having lost at most 5 minutes of data."
Why system design cares: "make it highly available" always resolves to a specific stack of these patterns — no single point of failure, replicated data, automatic failover, and a recovery plan. Naming the right pattern for each failure mode is the core of any availability discussion.
2.3 🏠 Real-world Analogy
Think of how an airplane is built to survive failure. It has two (or more) engines — if one dies mid-flight, the other flies the plane. That's redundancy and failover. Critical systems have backups — hydraulics, electronics, even the pilot has a co-pilot. Instruments are constantly monitored so a problem is caught immediately — that's health checks. If some non-essential system fails, the plane keeps flying with reduced features rather than falling out of the sky — graceful degradation. And there's a detailed emergency plan for the worst case — the equivalent of disaster recovery.
Crucially, the airline doesn't assume the engine will never fail — it assumes it will, and makes sure that when it does, passengers barely notice. That's exactly the software mindset: don't chase perfect components, make failures survivable.
| Airplane | System World | Meaning |
|---|---|---|
| ✈️ Two engines, either can fly the plane | ➕ Redundancy | No single component is essential |
| 🔀 One engine dies → the other takes over | 🔁 Failover | Switch to a healthy standby |
| 📋 Duplicate copies of key manuals/parts | 📑 Data replication | Copies survive losing one |
| 📟 Instruments monitored continuously | ❤️ Health checks | Detect failure in seconds |
| 🛬 Fly on with reduced non-critical systems | 📉 Graceful degradation | Partial service beats none |
| 🚨 Emergency landing plan | 🌐 Disaster recovery | Plan for the worst case |
Every one of these aviation habits maps directly to a software pattern below. The lesson is identical: build so that the failure of any single part is something the system absorbs, not something the user experiences.
2.4 📖 Key Terms
| Term | Simple Definition | Quick Example |
|---|---|---|
| Redundancy | Running spare copies of a component | Two load balancers, not one |
| SPOF | Single Point of Failure — one part downs everything | A lone database |
| Active-Passive | Standby waits idle, takes over on failure | Primary DB + standby replica |
| Active-Active | All copies serve traffic simultaneously | App servers behind an LB |
| Replication | Keeping copies of data on multiple nodes | Primary streams to replicas |
| Failover | Switching to a standby when the active fails | Promote a replica to primary |
| Health check | A probe that reports if a component is alive | LB pings /health |
| Heartbeat | Periodic "I'm alive" signal between nodes | Standby detects primary is gone |
| Graceful degradation | Reduced service instead of full outage | Hide recommendations if that service is down |
| Multi-AZ | Redundancy across data centres in a region | Servers in 3 availability zones |
| RTO | Recovery Time Objective — max acceptable downtime | Back up within 15 min |
| RPO | Recovery Point Objective — max acceptable data loss | Lose at most 5 min of data |
2.5 🔢 How It Works
The patterns layer together: redundancy removes single points of failure, replication protects the data, failover makes the switch automatic and fast, graceful degradation keeps you partly up when something still breaks, and disaster recovery covers the catastrophic case.
A. Redundancy — Eliminating Single Points of Failure
Redundancy means having more than one of every critical component so that no single failure is fatal. The first step is to hunt down every single point of failure (SPOF) — the lone load balancer, the single database primary, the one DNS entry — and duplicate it. There are two ways to run the copies:
- Active-Passive (standby) — one component actively serves traffic while a standby waits idle, ready to take over. Simpler and cheaper, but the standby's capacity sits unused until needed. Common for databases (primary + standby replica).
- Active-Active — all copies serve traffic at once behind a load balancer. No wasted capacity and instant tolerance of a loss, but requires the components to be stateless (or to share state) and adds coordination. Common for app servers.
This is where the availability math pays off: two redundant 99% components in parallel give 99.99%. Redundancy is applied at every layer — multiple load balancers, multiple app servers, multiple database nodes, and ideally across multiple availability zones (separate data centres in a region) so even a whole-building failure is survivable.
B. Data Replication
Redundant app servers are easy because they're stateless — but the data is the hard part. Replication keeps copies of your data on multiple nodes so that losing one node doesn't lose the data. A primary accepts writes and copies them to one or more replicas. There are two timing modes, and the choice is a real trade-off:
- Synchronous — a write isn't confirmed until at least one replica also has it. Zero data loss on failover (RPO ≈ 0), but every write is slower because it waits for the replica.
- Asynchronous — the primary confirms immediately and copies to replicas shortly after. Fast writes, but a crash can lose the last few unreplicated writes (small RPO > 0).
Replicas do double duty: they protect against data loss and serve read traffic (as covered in the scalability post). When the primary fails, a replica is promoted to become the new primary — which is exactly failover, next.
C. Failover & Health Checks
Redundancy is useless if nothing notices the failure or switches over. Health checks solve detection: a load balancer (or orchestrator) repeatedly probes each component — often an HTTP /health endpoint or a heartbeat signal — and marks any that stop responding as unhealthy, routing traffic away from them.
Failover is the switch itself: when the active component is marked unhealthy, traffic automatically moves to a healthy standby (or a replica is promoted to primary). Done well, it happens in seconds — slashing MTTR. One caution: automated failover must avoid split-brain, where two nodes both think they're the primary and accept conflicting writes; systems prevent this with quorums or a single authority deciding who's in charge.
D. Graceful Degradation
Sometimes a component fails and there's no standby — a third-party API is down, or a non-critical service is overloaded. Graceful degradation means the system keeps working in a reduced form instead of failing completely. On ShopEasy, if the recommendations service is down, the product page still loads — it just hides the "You may also like" section. The core purchase flow never depends on the optional extras.
Common techniques that enable this:
- Circuit breaker — after a downstream keeps failing, stop calling it for a while and immediately serve a fallback, so one sick service doesn't drag everything down (introduced in the message-queue post).
- Fallbacks — return a cached or default response when the live source is unavailable (last-known price, generic recommendations).
- Load shedding — under extreme load, deliberately reject or queue low-priority requests to protect the critical ones.
E. Disaster Recovery (RTO & RPO)
Redundancy within one region handles server and data-centre failures. Disaster recovery (DR) handles losing an entire region — a natural disaster, a major cloud outage. A DR plan is defined by two targets:
- RTO (Recovery Time Objective) — the maximum acceptable downtime: how fast must we be back? (e.g. 15 minutes)
- RPO (Recovery Point Objective) — the maximum acceptable data loss: how much recent data can we afford to lose? (e.g. 5 minutes)
Tighter targets cost more, giving a ladder of DR strategies from cheap-and-slow to expensive-and-instant:
| Strategy | How it works | RTO / RPO |
|---|---|---|
| Backup & Restore | Periodic backups to another region; restore after a disaster | Hours / hours — cheapest |
| Pilot Light | A minimal copy (data replicated, servers off) you scale up on demand | Tens of minutes / minutes |
| Warm Standby | A smaller always-on copy in another region, scaled up on failover | Minutes / seconds |
| Multi-region Active-Active | Full deployment serving live traffic in multiple regions | ~0 / ~0 — costliest |
📌 RTO/RPO drive the DR choice. "Back in 15 min, lose ≤ 5 min of data" rules out backup-restore and points at warm standby. "Zero downtime, zero loss" demands multi-region active-active — and its cost. Pick the cheapest strategy that still meets the targets the business actually needs.
2.6 🔀 Types & Variations
Redundancy comes in escalating levels, each surviving a bigger kind of failure — and each costing more. You climb this ladder only as far as your availability target requires.
Single Instance
One of everything. Survives nothing — any failure is downtime.
- Cheapest; a SPOF at every layer
- Fine only for non-critical/dev
Multi-Instance
Several copies in one data centre behind an LB. Survives a server failure.
- Redundancy + failover
- Still exposed to a data-centre outage
Multi-AZ
Copies across availability zones (separate data centres in a region). Survives a data-centre failure.
- The standard for production apps
- Exposed only to a full-region outage
Multi-Region
Full deployments in different geographic regions. Survives a whole region disaster.
- Highest availability; disaster recovery
- Most complex and costly
Climb the ladder to match your target. Multi-instance gets you a couple of nines; multi-AZ is the sweet spot for most production systems (survives a data-centre loss); multi-region is reserved for services that truly can't be down and can justify the cost and complexity.
2.7 🎨 Illustrated Diagram
The diagram shows a highly-available, multi-AZ setup. Redundant load balancers spread traffic to app servers in two availability zones; the database primary replicates to a standby in the other zone and fails over to it if the primary dies. No single component is a SPOF.
Reading the diagram: lose an app server and the load balancer routes to the others; lose the whole of AZ-1 (both an app server and the DB primary) and traffic shifts to AZ-2 while the standby is promoted to primary. Every layer has a spare, so no single failure — server or data centre — becomes downtime.
2.8 ✅ When to Use
You don't apply every pattern everywhere — you match each to the failure it defends against and to your availability target. Here's which pattern solves which problem:
| To survive… | Use… |
|---|---|
| A single server crashing | Redundancy (multi-instance) + failover + health checks |
| Losing a disk or database node | Replication (+ promote a replica on failover) |
| A whole data centre going down | Multi-AZ redundancy |
| An entire region disaster | Disaster recovery (multi-region, sized by RTO/RPO) |
| A non-critical dependency failing | Graceful degradation (fallbacks, circuit breaker) |
| A slow/failing downstream cascading | Circuit breaker + load shedding |
And how far up the redundancy ladder to climb:
| Invest more in availability when… | Keep it simpler when… |
|---|---|
| Downtime directly loses revenue or safety | It's an internal or non-critical service |
| You target four nines or more | Two–three nines is acceptable |
| Data loss is unacceptable (payments, records) | Data can be regenerated or re-fetched |
| An SLA with penalties is on the line | Best-effort uptime is fine |
Rule of thumb: eliminate SPOFs first (redundancy + failover + health checks), replicate your data, and go multi-AZ — that combination gets most systems to ~99.99% affordably. Reserve multi-region DR for services that genuinely can't tolerate a regional outage, and add graceful degradation everywhere as a cheap safety net.
2.9 🏗️ Real-world Example — Making ShopEasy Survive Failures
Watch each pattern kick in as different things fail during a normal shopping day — the user never sees an outage:
| Step | Failure | Pattern that saves the day |
|---|---|---|
| ① | An app server crashes mid-afternoon | ❤️ Health check marks it unhealthy in seconds; ➕ redundant servers absorb its traffic — no downtime |
| ② | The database primary's disk dies | 📑 Replication means the data is safe; 🔁 failover promotes the standby replica to primary automatically |
| ③ | The recommendations service is overloaded | 📉 Graceful degradation — product pages load without the "You may also like" section; checkout is unaffected |
| ④ | A flaky payment gateway starts timing out | 🔌 Circuit breaker stops hammering it and shows a "try another method" fallback instead of hanging |
| ⑤ | An entire availability zone goes dark | 🏢 Multi-AZ redundancy — traffic and the DB shift to the healthy zone |
| ⑥ | The whole cloud region has a major outage | 🌍 Disaster recovery — warm standby in another region takes over within the RTO, losing ≤ the RPO of data |
The payoff: six different failures — from one server to a whole region — and in every case a pattern absorbed it. That's what "designed for failure" looks like: the availability the metrics sub-topic asked for (99.99%+) delivered by stacking redundancy, replication, failover, degradation, and DR. No single failure ever reached the customer.
2.10 ⚖️ Trade-offs
These patterns buy resilience, but every spare component and every failover path adds cost and complexity. The trade-offs:
| ✅ Advantages | ❌ Costs |
|---|---|
| No single point of failure — one component's death isn't an outage | Duplicated cost — you pay for spare, often idle, capacity |
| Higher availability — redundancy multiplies the nines | Complexity — failover, replication, and DR to build, test, and operate |
| Data safety — replication survives node and DC loss | Consistency tension — async replication risks small data loss; sync is slower |
| Fast recovery — automated failover slashes MTTR | New failure modes — split-brain, failover bugs, flapping health checks |
| Survives disasters — multi-region rides out a region outage | Testing burden — untested failover often fails when it's finally needed |
📌 The core tension: resilience is bought with redundancy and complexity. More copies mean more cost and more moving parts that can themselves misbehave. The art is applying just enough — usually multi-AZ redundancy plus replication and failover — to meet the target without drowning in operational overhead.
2.11 🚫 Common Mistakes
| # | ❌ Common Mistake | ✅ The Reality |
|---|---|---|
| 1 | Redundant servers, single database | Adding app servers but leaving one database still leaves a SPOF. Replicate and make the data tier redundant too — it's usually the real weak point. |
| 2 | Never testing failover | Failover that's never exercised often breaks when needed. Run drills / chaos testing so recovery works in a real incident, not just on paper. |
| 3 | Forgetting the failover path is a SPOF too | A single load balancer or one health-check service can itself be the SPOF. Make the redundancy mechanism redundant. |
| 4 | Ignoring split-brain | Naive automatic failover can promote two primaries that accept conflicting writes. Use quorums or a single authority to decide the leader. |
| 5 | Confusing backups with a DR plan | Having backups isn't disaster recovery. You need defined RTO/RPO and a tested restore/failover process, or "recovery" takes days. |
| 6 | All redundancy in one data centre | Ten servers in one building all die if the building loses power. Spread redundancy across availability zones (and regions for DR). |
2.12 📝 Summary
- Design for failure — assume every component will fail and make failures survivable and invisible, not impossible.
- Redundancy removes SPOFs — active-passive or active-active copies at every layer; two 99% parts in parallel give 99.99%.
- Replication protects data + failover switches over — health checks detect failure in seconds and promote a standby, slashing MTTR.
- Graceful degradation keeps you partly up — fallbacks and circuit breakers serve reduced service instead of a full outage.
- Climb only as high as needed — multi-AZ for most systems; multi-region DR (sized by RTO/RPO) for the truly critical.
2.13 🏋️ Design Challenge
🏦 Challenge: Make a banking API highly available
A bank's transfer API must target 99.99% availability and must never lose a committed transaction. Think through the following:
- Where are the single points of failure, and how do you remove each one?
- For the database, would you use synchronous or asynchronous replication — and what does that mean for RPO?
- How does the system detect a failed node and switch over quickly (low MTTR)?
- The bank wants to survive losing an entire region. What DR strategy fits "back within 5 minutes, zero data loss"?
👁️ Show Answer
Remove SPOFs: redundant load balancers, multiple stateless app servers behind them, and a database with a standby — all spread across at least two availability zones. Nothing critical should exist as a single copy, including the failover mechanism itself.
Replication mode: synchronous. A bank cannot lose a committed transaction, so a write must be confirmed on a replica before it's acknowledged — that gives RPO ≈ 0. You accept slightly slower writes as the price of zero data loss.
Fast detection & switchover: continuous health checks / heartbeats mark a dead node in seconds and trigger automatic failover — promoting the synchronous standby to primary — with a quorum to prevent split-brain. Automated failover keeps MTTR to seconds, which is what buys the fourth nine.
Region loss with RTO 5 min / RPO 0: those tight targets rule out backup-restore and pilot light. You need at least a warm standby in a second region with synchronous (or near-real-time) cross-region replication — or, for true zero, multi-region active-active. Pick the cheapest that still meets 5 min / 0, and test the failover regularly.
2.14 ☁️ Cloud Service Mapping
Clouds provide these patterns as managed features — you configure redundancy and failover rather than building them:
| Pattern | AWS (Primary) | GCP | Azure |
|---|---|---|---|
| Multi-AZ redundancy — survive a data-centre loss | Availability Zones + Auto Scaling | Zonal/Regional MIGs | Availability Zones + VM Scale Sets |
| DB replication & auto-failover | RDS / Aurora Multi-AZ | Cloud SQL HA / AlloyDB | Azure SQL failover groups |
| Failover routing & health checks | Route 53 health checks + ELB | Cloud Load Balancing health checks | Azure Traffic Manager / Front Door |
| Disaster recovery — multi-region | Cross-Region Replication + Route 53 failover | Multi-region + global LB | Azure Site Recovery + geo-replication |
Simplest AWS picture: run app servers in an Auto Scaling group across multiple Availability Zones behind an Elastic Load Balancer with health checks, use RDS/Aurora Multi-AZ for automatic database failover, and for disaster recovery replicate to a second region with Route 53 DNS failover. The platform handles the redundancy and failover — you set the targets and test them.
📚 References
- System Design Interview (Vol. 1) — Alex Xu — Uses availability, redundancy, and failover as building blocks in every design.
- Designing Data-Intensive Applications — Martin Kleppmann — Deep coverage of replication, failover, and the reliability of distributed data.
- Google SRE Book — The canonical treatment of SLIs, SLOs, error budgets, and MTTR-focused reliability engineering.
- AWS Well-Architected Framework — Reliability Pillar — Practical patterns for redundancy, Multi-AZ, and disaster recovery (RTO/RPO strategies).
- Cloudflare / AWS Learning Centers — Beginner-friendly explanations of high availability, failover, and the nines.